
Point-in-time universe
Each step uses the top 50 USDT contracts by the turnover available at that time, without future universe knowledge.
 MOMENTUM CORE + REGIME-DRIVEN BTC OVERLAY
CTREND combines two independent layers: a relative-momentum portfolio at 0.50x gross exposure and a separate BTC position of up to 0.50x. The BTC overlay activates only in a positive medium-term regime.
Each step uses the top 50 USDT contracts by the turnover available at that time, without future universe knowledge.
The systematic core allocates up to 0.50x gross across strong and weak instruments while limiting total risk.
Up to 0.50x BTC is added when the 4H close is above its roughly 30-day-ago level; the layer is removed as the regime weakens.
Signals are fixed on a closed 4H candle and execution is modeled at the next hourly open.
The strategy and BTC Buy & Hold start from the same normalized point.
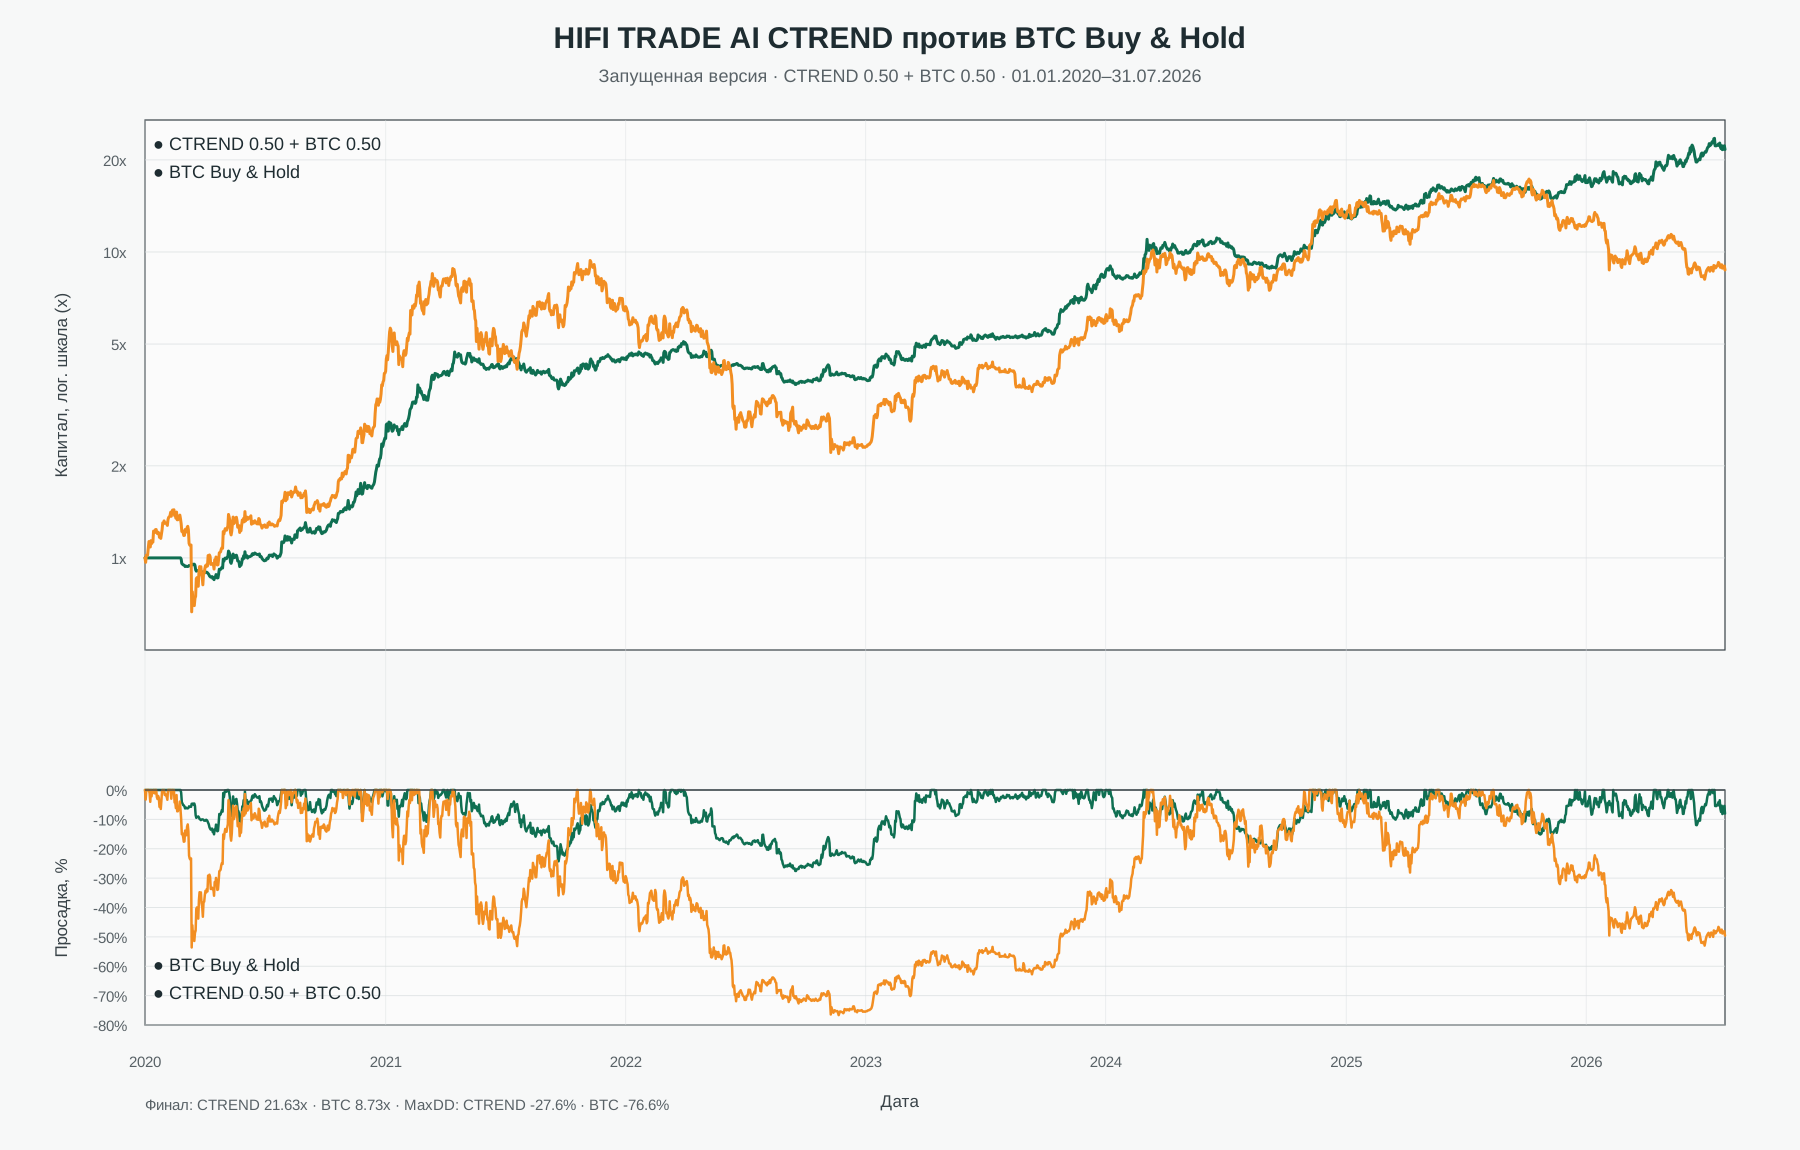
| Metric | AI CTREND | BTC B&H |
|---|---|---|
| Final equity | 21.63x | 8.73x |
| Total return | +2063.3% | +773.3% |
| CAGR | 59.6% | 39.0% |
| Annual volatility | 29.3% | 60.6% |
| Sharpe | 1.741 | 0.853 |
| Sortino | 2.908 | 1.242 |
| Maximum drawdown | −27.6% | −76.6% |
| Calmar | 2.161 | 0.509 |
| Year | AI CTREND | BTC B&H |
|---|---|---|
| 2020 | +146.7% | +301.7% |
| 2021 | +81.5% | +57.6% |
| 2022 | −14.6% | −65.3% |
| 2023 | +116.8% | +154.5% |
| 2024 | +55.1% | +111.8% |
| 2025 | +28.1% | −7.3% |
| 2026* | +28.3% | −29.2% |
Before connecting, review the copy settings and the level of risk you can accept.
Connect on Bybit